![[banner]](images/banner.png "Batsto Lake, Wharton State Forest, New Jersey")
USDA soil texture for a soil sample is determined from the relative proportions of sand, silt, and clay in the fine earth fraction of the soil sample.
The R package soiltexture can be used to plot soil texture on a ternary plot or to determine the soil texture without plotting.
Packages used in this chapter
if(!require(soiltexture)){install.packages("soiltexture")}
if(!require(tidyverse)){install.packages("tidyverse")}
if(!require(ggtern)){install.packages("ggtern")}
library(soiltexture)
library(ggplot2)
library(ggtern)
library(plyr)
library(dplyr)
Plotting soil separates on a ternary USDA soil texture plot
For the following code, you can enter values for sand, silt, and clay separates in centimeters or inches in a jar, or as percent or as fraction of the total fine earth fraction.
In the data frame below, “Orchard” and “Pasture” are in percents that add to 100. “Lawn” and “Garden” are relative heights from soil jar test (Clemson Cooperative Extension, 2003).
For the following code, the sand, silt, and clay separates values must be in columns 2 to 4 of the data frame in order to convert soil separates values to percents. If this conversion is skipped, the sand, silt, and clay values can be in other columns.
Example with four hypothetical soils
Data = read.table(header=TRUE, text="
Soil Sand Silt Clay
Lawn 3.4 2.2 4.4
Garden 3.5 5.0 1.5
Orchard 60 10 30
Pasture 70 15 15
")
### Define a few parameters for the plot
OffsetX = -5
OffsetY = 0
SampleColor = "dodgerblue4"
### Convert soil separates to percents
for(i in 1:nrow(Data)){
Data[i,2:4] = Data[i,2:4] / sum(Data[i,2:4]) * 100
}
rowSums(Data[, 2:4])
[1] 100 100 100 100
### Create labels for USDA soil texture
classes
data(USDA)
USDA_text = USDA %>% group_by(Label) %>%
summarise_if(is.numeric, mean, na.rm = TRUE)
### Clean up a couple of labels for the plot
USDA_text$Label = as.character(USDA_text$Label)
USDA_text$Label[USDA_text$Label == "Loamy Sand"] =
"Loamy\nSand"
USDA_text$Label[USDA_text$Label == "Sandy Clay"] =
"Sandy\nClay"
USDA_text$Label[USDA_text$Label == "Silty Clay Loam"] = "Silty
Clay\nLoam"
### Make ternary plot of Data
Plot =
ggplot(data = USDA, aes(
y = Clay,
x = Sand,
z = Silt
)) +
coord_tern(L = "x", T = "y", R = "z") +
geom_polygon(
aes(fill = Label),
alpha = 0.00,
size = 0.50,
color = "black"
) +
geom_text(data = USDA_text,
aes(label = Label, x=Sand, y=Clay),
color = 'black',
size = 2, position="identity") +
geom_point(
data = Data,
aes(x = Sand, y = Clay, z = Silt),
color = SampleColor,
size = 1) +
geom_text(data = Data,
aes(label = Soil, x=Sand + OffsetX, y=Clay + OffsetY, z=Silt),
hjust=0, vjust=0.5,
color = SampleColor,
size = 2, position="identity") +
theme_bw() +
theme_showarrows() +
theme_clockwise() +
theme(text = element_text()) +
guides(fill=FALSE, color=FALSE)
### Save plot file
ggsave(filename="SoilTriangleResults.png",
plot = Plot,
width = 6,
height = 3.5,
dpi = 300,
units = "in")
### Display plot
Plot
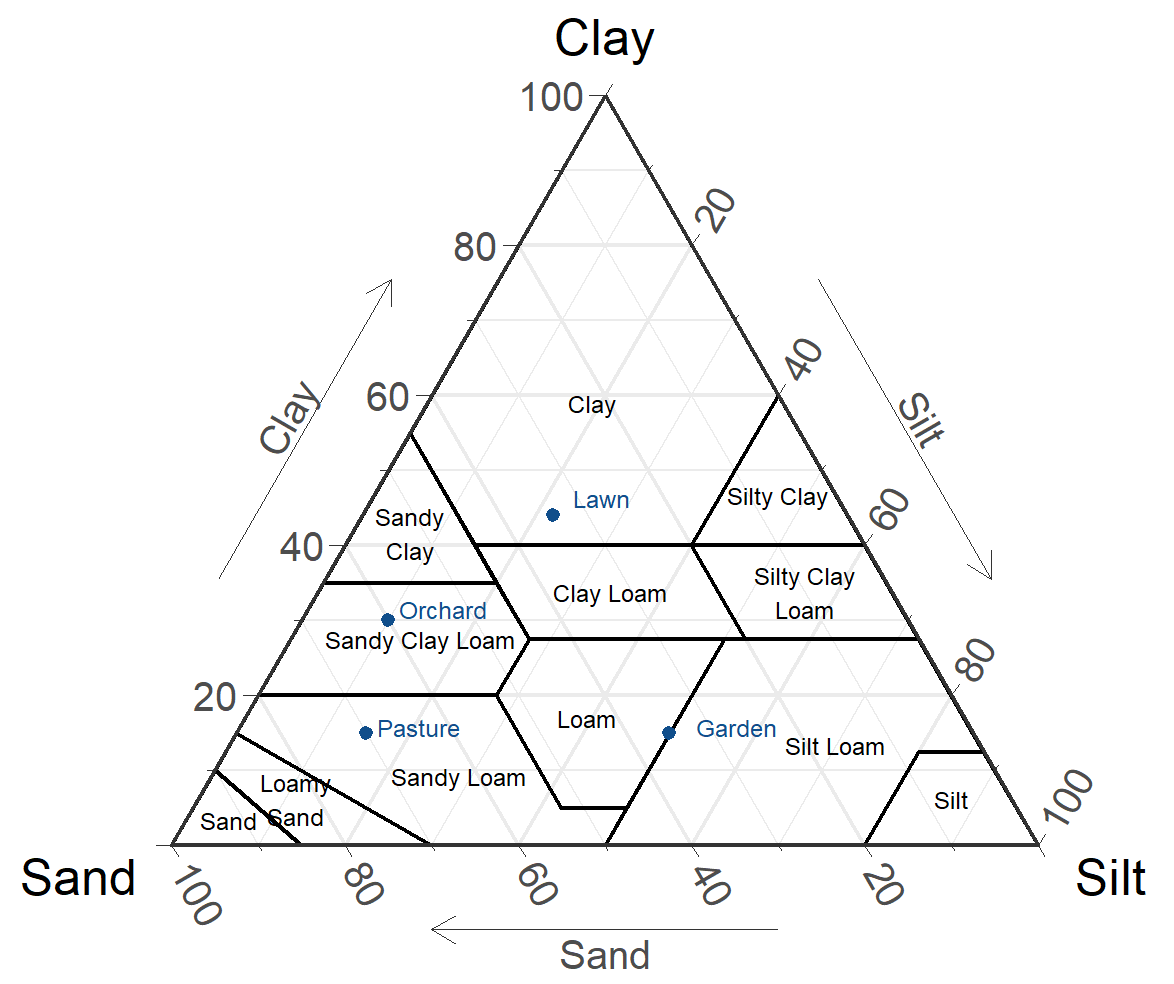
Ternary plot of the USDA soil texture triangle with four hypothetical soils
plotted by sand, silt, and clay soil separates to determine soil texture. Note
that the “Garden” soil is precisely on the cutoff for loam and silt loam.
Determining the USDA soil texture without plotting
The TT.points.in.classes() function in the soiltexture package will return the USDA soil texture based on the sand, silt, and clay values.
However, the function returns non-standard abbreviations for soil texture. These could be easily converted with the table below.
soiltexture Texture Official
package abbreviation
abbreviation
Cl clay c
SiCl silty clay sic
SaCl sandy clay sc
ClLo clay loam cl
SiClLo silty clay loam sicl
SaClLo sandy clay loam scl
Lo loam l
SiLo silty loam sil
SaLo sandy loam sl
Si silt si
LoSa loamy sand ls
Sa sand s
Example with four hypothetical soils
Data = read.table(header=TRUE, text="
Soil Sand Silt Clay
Lawn 3.4 2.2 4.4
Garden 3.5 5.0 1.5
Orchard 60 10 30
Pasture 70 15 15
")
### Convert soil separates to percents
for(i in 1:nrow(Data)){
Data[i,2:4] = Data[i,2:4] / sum(Data[i,2:4]) * 100
}
rowSums(Data[, 2:4])
[1] 100 100 100 100
Out =
TT.points.in.classes(
tri.data = Data,
class.sys = "USDA.TT",
css.names = c("Clay", "Silt", "Sand"),
PiC.type="t"
)
Out
"Cl" "Lo, SiLo" "SaClLo" "SaLo"
### The textures for the soils are
### clay, loam / silty loam, sandy clay loam, and sandy loam,
### or abbreviated as c, l/sil, scl,
and sl.
Automatically convert output to texture and USDA abbreviations
Note that in the following code, for values that fall precisely between two textural class, only the first class is converted. However, in this case, an asterisk is added to alert the user that the result borders two classes.
Dictionary = read.table(header=TRUE, text="
Package Texture Abbreviation
Cl 'clay' c
SiCl 'silty clay' sic
SaCl 'sandy clay' sc
ClLo 'clay loam' cl
SiClLo 'silty clay loam' sicl
SaClLo 'sandy clay loam' scl
Lo 'loam' l
SiLo 'silty loam' sil
SaLo 'sandy loam' sl
Si 'silt' si
LoSa 'loamy sand' ls
Sa 'sand' s
")
Data$TextureTT = Out
Out2 = sub(",.*", "", Out)
Data$Texture = mapvalues(Out2, from=Dictionary$Package,
to=Dictionary$Texture)
Data$Abbreviation = mapvalues(Out2, from=Dictionary$Package,
to=Dictionary$Abbreviation)
Data$Multiple = ""
Data$Multiple[grep(",", Out)] ="*"
Data$Sand = round(Data$Sand, 1)
Data$Silt = round(Data$Silt, 1)
Data$Clay = round(Data$Clay, 1)
Data
Soil Sand Silt Clay TextureTT Texture Abbreviation Multiple
1 Lawn 34 22 44 Cl clay c
2 Garden 35 50 15 Lo, SiLo loam l *
3 Orchard 60 10 30 SaClLo sandy clay loam scl
4 Pasture 70 15 15 SaLo sandy loam sl
References
Clemson Cooperative Extension. 2023. Soil Texture Analysis “The Jar Test”. Factsheet HGIC 1656. hgic.clemson.edu/factsheet/soil-texture-analysis-the-jar-test/.
Moeys, J. 2024. soiltexture: Functions for Soil Texture Plot, Classification and Transformation. CRAN.R-project.org/package=soiltexture.