![[banner]](images/banner.png "Batsto Lake, Wharton State Forest, New Jersey")
Introduction
When to use it
Null hypothesis
How the test works
Assumptions
See the Handbook for information on these topics.
Example
One sample t-test with observations as vector
###
--------------------------------------------------------------
### One-sample t-test, transferrin example, pp. 124
### --------------------------------------------------------------
observed = c(0.52, 0.20, 0.59, 0.62, 0.60)
theoretical = 0
t.test(observed,
mu = theoretical,
conf.int = 0.95)
One Sample t-test
t = 6.4596, df = 4, p-value = 0.002958
# # #
Graphing the results
See the Handbook for information on this topic.
Similar tests
The paired t-test and two-sample t-test are presented elsewhere in this book.
How to do the test
One sample t-test with observations in data frame
###
--------------------------------------------------------------
### One-sample t-test, SAS example, pp. 125
### --------------------------------------------------------------
Input =("
Angle
120.6
116.4
117.2
118.1
114.1
116.9
113.3
121.1
116.9
117.0
")
Data = read.table(textConnection(Input),header=TRUE)
observed = Data$ Angle
theoretical = 50
t.test(observed,
mu = theoretical,
conf.int=0.95)
One Sample t-test
t = 87.3166, df = 9, p-value = 1.718e-14
### Does not agree with Handbook. The Handbook results are incorrect.
### The SAS code produces the following result.
T-Tests
Variable DF t Value Pr > |t|
angle 9 87.32 <.0001
Histogram
hist(Data$ Angle,
col="gray",
main="Histogram of values",
xlab="Angle")
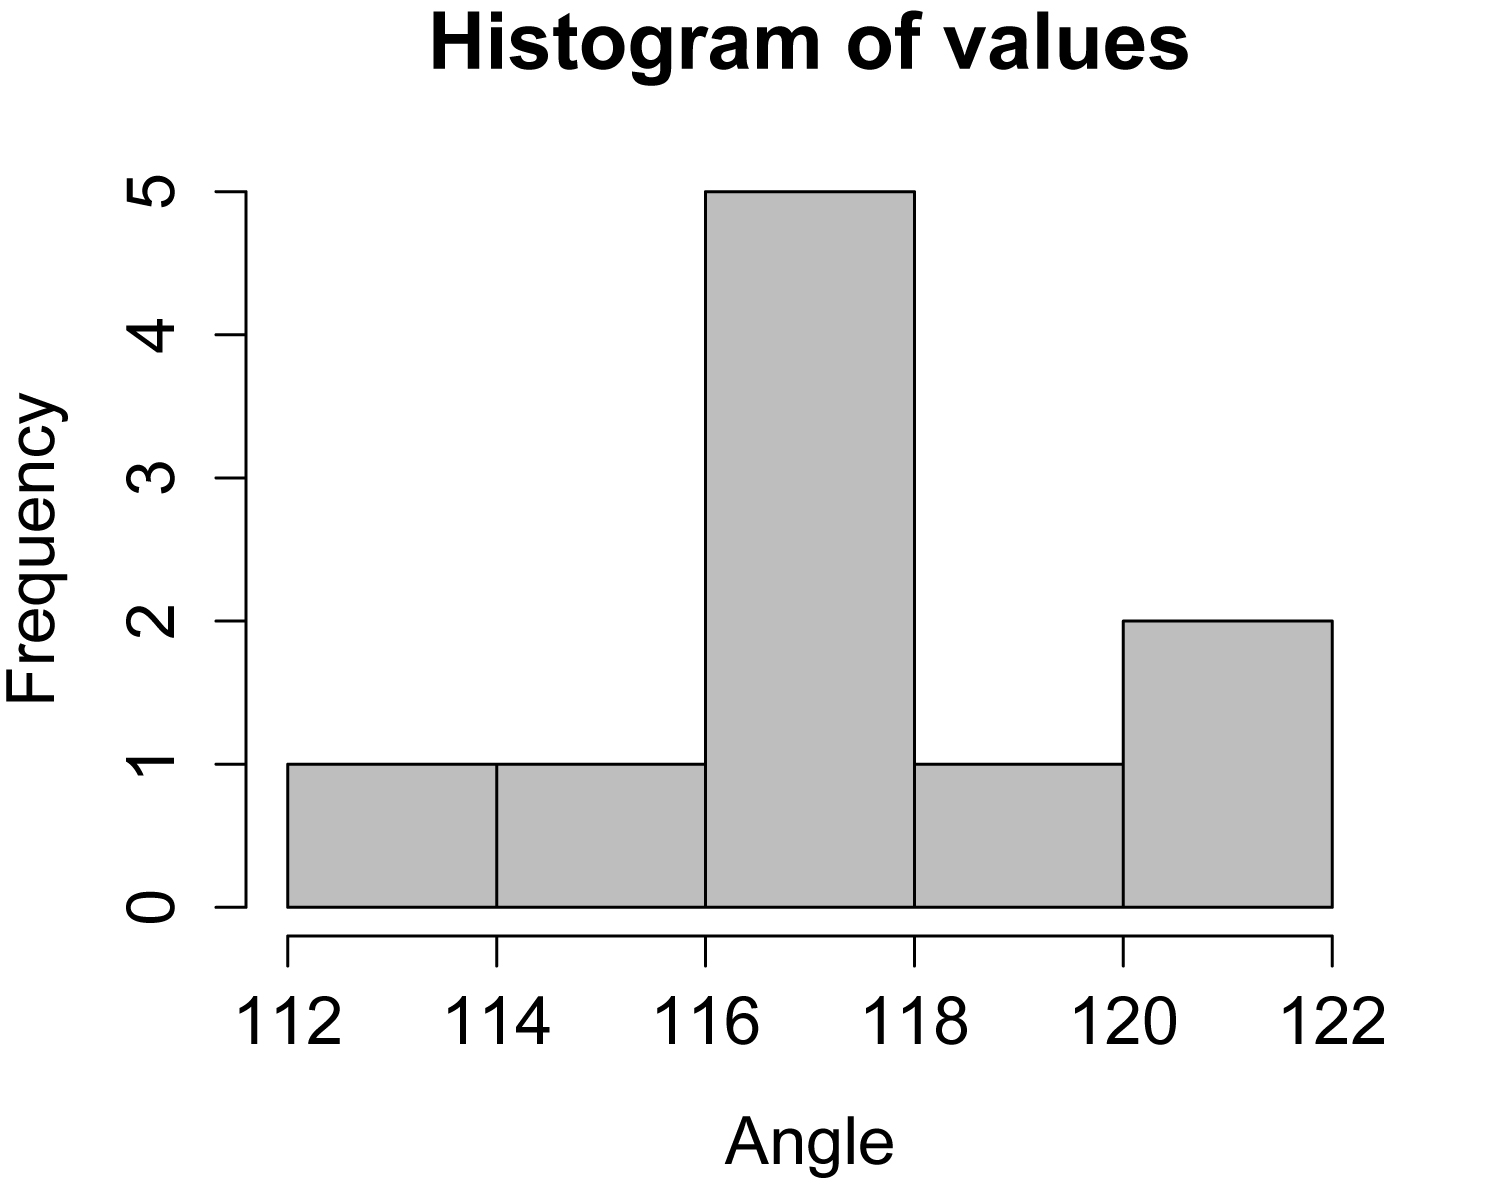
Histogram of data in a single population from a one-sample t-test. Distribution of these values should be approximately normal.
# # #
Power analysis
Power analysis for one-sample t-test
###
--------------------------------------------------------------
### Power analysis, t-test, one-sample,
### hip joint example, pp. 125–126
### --------------------------------------------------------------
M1 = 70 # Theoretical mean
M2 = 71 # Mean to detect
S1 = 2.4 # Standard
deviation
S2 = 2.4 # Standard
deviation
Cohen.d = (M1 - M2)/sqrt(((S1^2) + (S2^2))/2)
library(pwr)
pwr.t.test(
n = NULL, # Observations
d = Cohen.d,
sig.level = 0.05, # Type I
probability
power = 0.90, # 1 minus Type II
probability
type = "one.sample", # Change
for one- or two-sample
alternative = "two.sided")
One-sample t test power calculation
n = 62.47518
# # #