![[banner]](images/banner.jpg "Cohansey River, Fairfield, New Jersey")
Measures of association for two ordinal variables
Measures of association for ordinal variables include Kendall’s tau-b, Kendall’s tau-c (presented in the previous chapter), as well as Somers’ D (or delta), and Goodman and Kruskal's gamma.
Yule's Q is equivalent in magnitude to Goodman and Kruskal's gamma for a 2 x 2 table, but can be either positive or negative depending on the order of the cells in the table.
Measures of association for one ordinal variable and one nominal variable
The statistics Freeman’s theta, epsilon-squared, and eta-squared are used to gauge the strength of the association between one ordinal variable and one nominal variable. All of these statistics range from 0 to 1, with 0 indicating no association and 1 indicating perfect association.
As effect sizes, these statistics are not affected by the sample size per se. epsilon-squared is usually used as the effect size for a Kruskal–Wallis test, whereas Freeman’s theta is most often used as an effect size for data arranged in a table, such as for a Cochran–Armitage test. However, it is my understanding that neither statistic assumes or prohibits one variable being designated as the dependent variable.
Notes on epsilon-squared and eta-squared, and their relation to r-squared and adjusted r-squared are presented in the Kruskal–Wallis chapter.
Polychoric and tetrachoric correlation
Polychoric correlation is used to measure the degree of correlation between two ordinal variables with the assumption that each ordinal variable is a discrete summary of an underlying (latent) normally-distributed continuous variable. For example, if an ordinal variable Height were measured as very short, short, average, tall, very tall, one could assume that these categories represent actual height measurements that are continuous and normally distributed. A similar assumption might be made for Likert items, for example on an agree–disagree spectrum.
Tetrachoric correlation is a special case of polychoric correlation when both variables are dichotomous.
Appropriate data
• One ordinal variable and one nominal variable. Or two ordinal variables. Here, usually expressed as a contingency table.
• Experimental units aren’t paired.
Hypotheses
• There are no hypotheses tested directly with these statistics.
Other notes and alternative tests
• Cramér’s V and phi are used for tables with two nominal variables. Cohen’s w is a variant. Goodman and Kruskal’s lambda is also used in these cases.
• Biserial and polyserial correlation are used for one continuous variable and one ordinal (or dichotomous) variable, when there is an assumption that the ordinal variable represents a latent continuous variable.
Packages used in this chapter
The packages used in this chapter include:
• rcompanion
• psych
• DescTools
The following commands will install these packages if they are not already installed:
if(!require(rcompanion)){install.packages("rcompanion")}
if(!require(psych)){install.packages("psych")}
if(!require(DescTools)){install.packages("DescTools")}
Examples for Freeman’s theta and epsilon-squared
The hypothetical Breakfast example from the previous chapter includes Breakfast as an ordinal variable and Travel as a nominal variable.
Input =(
"Breakfast Never Rarely Sometimes Often Always
Travel
Walk 6 9 6 5 2
Bus 2 5 8 5 3
Drive 2 4 6 8 8
")
Tabla = as.table(read.ftable(textConnection(Input)))
Tabla
Freeman’s theta
library(rcompanion)
freemanTheta(Tabla,
group = "row")
Freeman.theta
0.312
Note that the values for the confidence interval are calculated by bootstrap, and so will vary with each run.
freemanTheta(Tabla,
group = "row",
ci = TRUE)
Freeman.theta lower.ci upper.ci
1 0.312 0.13 0.51
Epsilon-squared
library(rcompanion)
epsilonSquared(Tabla,
group = "row")
epsilon.squared
0.11
Note that the square root of epsilon-squared is usually similar in magnitude to Freeman’s theta.
epsilon = sqrt(epsilonSquared(Tabla, group = "row"))
names(epsilon) = "epsilon"
epsilon
epsilon
0.3316625
epsilonSquared(Tabla,
group = "row",
ci = TRUE)
epsilon.squared lower.ci upper.ci
1 0.11 0.0183 0.293
sqrt(c(0.11, 0.0183, 0.293))
[1] 0.3316625 0.1352775 0.5412947
Eta-Squared
library(rcompanion)
ordinalEtaSquared(Tabla, group="row")
eta.squared
0.0865
eta = sqrt(ordinalEtaSquared(Tabla, group = "row"))
names(eta) = "eta"
eta
eta
0.2941088
ordinalEtaSquared(Tabla, group="row", ci=TRUE)
eta.squared lower.ci upper.ci
1 0.0865 -0.00288 0.282
The hypothetical example with Pooh, Piglet, and Tigger includes Likert as an ordinal variable and Speaker as a nominal variable.
Input =(
"Likert 1 2 3 4 5
Speaker
Pooh 0 0 1 6 3
Piglet 1 6 2 1 0
Tigger 0 0 2 6 2
")
Tabla = as.table(read.ftable(textConnection(Input)))
Tabla
Freeman’s theta
library(rcompanion)
freemanTheta(Tabla,
group = "row")
Freeman.theta
0.64
Epsilon-squared
library(rcompanion)
epsilonSquared(Tabla,
group = "row")
epsilon.squared
0.581
Eta-Squared
library(rcompanion)
ordinalEtaSquared(Tabla, group="row")
eta.squared
0.55
Comparison of Freeman’s theta, epsilon-squared, and Kendall’s tau
In cases where there are two levels of the nominal variable, Freeman’s theta and Kendall’s tau-c are often similar in magnitude, and the square root of epsilon-squared will often be relatively similar as well.
Input =(
"Ordinal 1 2 3 4 5
Category
A 15 12 11 6 5
B 6 7 8 15 20
")
Tabla = as.table(read.ftable(textConnection(Input)))
Tabla
Ordinal
Category 1 2 3 4 5
A 15 12 11 6 5
B 6 7 8 15 20
library(rcompanion)
freemanTheta(Tabla)
Freeman.theta
0.456
library(DescTools)
round(StuartTauC(Tabla), 3)
[1] 0.454
library(rcompanion)
round(sqrt(epsilonSquared(Tabla)), 3)
epsilon.squared
0.402
Additional examples for Freeman’s theta and epsilon-squared
Perfect association
Input =(
"Ordinal 1 2 3
Category
A 10 0 0
B 0 10 0
C 0 0 10
")
Tabla = as.table(read.ftable(textConnection(Input)))
Tabla
library(rcompanion)
freemanTheta(Tabla)
Freeman.theta
1
library(rcompanion)
epsilonSquared(Tabla)
epsilon.squared
1
Zero association
Input =(
"Ordinal 1 2 3
Category
A 5 5 5
B 10 10 10
C 15 15 15
")
Tabla = as.table(read.ftable(textConnection(Input)))
Tabla
library(rcompanion)
freemanTheta(Tabla)
Freeman.theta
0
library(rcompanion)
epsilonSquared(Tabla)
epsilon.squared
0
Examples for Somers’ D, Kendall’s tau, and Goodman and Kruskal's gamma
First example
This example includes two ordinal variables, Adopt and Size, arranged into a contingency table of counts.
Input =(
"Adopt Always Sometimes Never
Size
Hobbiest 0 1 5
Mom-and-pop 2 3 4
Small 4 4 4
Medium 3 2 0
Large 2 0 0
")
Tabla = as.table(read.ftable(textConnection(Input)))
Tabla
library(DescTools)
SomersDelta(Tabla,
direction = "column",
conf.level = 0.95)
somers lwr.ci ups.ci
-0.4665127 -0.6452336 -0.2877918
### Somers' D for (Column | Row), with confidence
interval
library(DescTools)
KendallTauB(Tabla,
conf.level = 0.95)
tau_b lwr.ci ups.ci
-0.4960301 -0.6967707 -0.2952895
### Kendall’s tau-b with confidence interval
library(DescTools)
StuartTauC(Tabla,
conf.level = 0.95)
tauc lwr.ci upr.ci
-0.5242215 -0.7477650 -0.3006779
### Kendall’s tau-c with confidence interval
library(DescTools)
GoodmanKruskalGamma(Tabla,
conf.level = 0.95)
gamma lwr.ci ups.ci
-0.6778523 -0.9199026 -0.4358021
### Goodman and Kruskal’s gamma with confidence
interval
Second example
This example includes two ordinal variables, Tired and Happy, arranged into a contingency table of counts.
Input =(
"Tired 1 2 3 4
Happy
1 0 0 0 3
2 0 0 0 2
3 0 0 3 0
4 2 0 0 0
5 3 2 0 5
")
Tabla = as.table(read.ftable(textConnection(Input)))
Tabla
library(DescTools)
SomersDelta(Tabla,
direction = "row",
conf.level = 0.95)
somers lwr.ci ups.ci
-0.32061069 -0.68212474 0.04090337
### Somers' D for (Row | Column), with confidence
interval
library(DescTools)
KendallTauB(Tabla,
conf.level = 0.95)
tau_b lwr.ci ups.ci
-0.31351142 -0.67251606 0.04549322
### Kendall’s tau-b with confidence interval
library(DescTools)
StuartTauC(Tabla,
conf.level = 0.95)
tauc lwr.ci upr.ci
-0.28000000 -0.62203103 0.06203103
### Kendall’s tau-c with confidence interval
library(DescTools)
GoodmanKruskalGamma(Tabla,
conf.level = 0.95)
gamma lwr.ci ups.ci
-0.42000000 -0.87863057 0.038630
### Goodman and Kruskal’s gamma with confidence
interval
Examples for polychoric correlation
First example
This example includes two ordinal variables, Adopt and Size. A single correlation coefficient is produced.
Input =(
"Adopt Always Sometimes Never
Size
Hobbiest 0 1 5
Mom-and-pop 2 3 4
Small 4 4 4
Medium 3 2 0
Large 2 0 0
")
Tabla = as.table(read.ftable(textConnection(Input)))
Tabla
library(psych)
polychoric(Tabla,
correct=FALSE)
$rho
[1] -0.678344
Second example
This example includes two ordinal variables, Tired and Happy.
Input =(
"Tired 1 2 3 4
Happy
1 0 0 0 3
2 0 0 0 2
3 0 0 3 0
4 2 0 0 0
5 3 2 0 5
")
Tabla = as.table(read.ftable(textConnection(Input)))
Tabla
library(psych)
polychoric(Tabla,
correct=FALSE)
$rho
[1] -0.495164
Third example
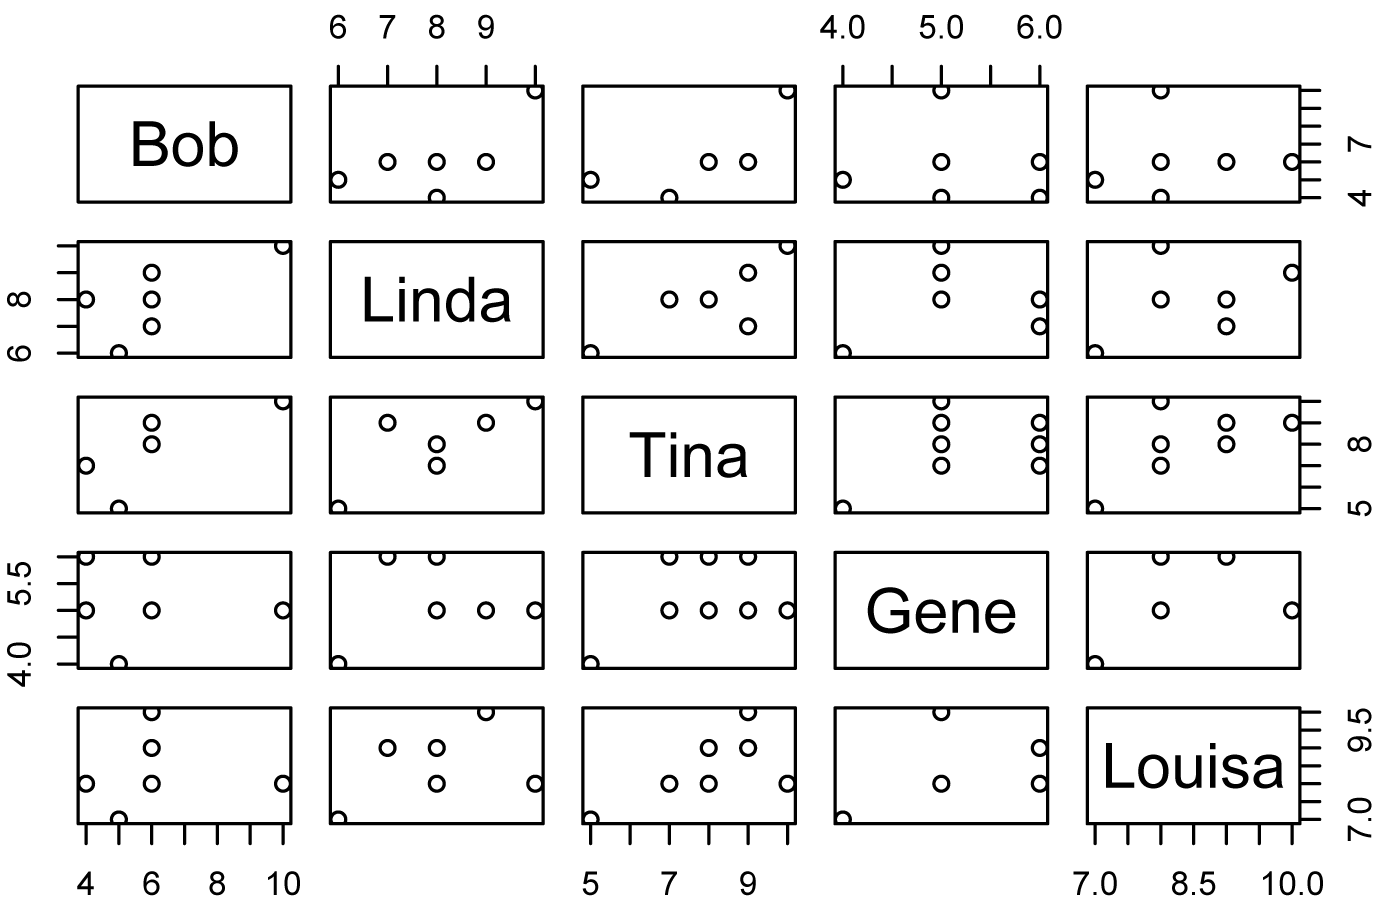
The following example revisits the Belcher family data. Here, we want to know if the scores among instructors are correlated. This makes sense since each rater rated each instructor.
Data = read.table(header=TRUE, stringsAsFactors=TRUE, text="
Rater Bob Linda Tina Gene Louisa
a 4 8 7 6 8
b 5 6 5 4 7
c 4 8 7 5 8
d 6 8 8 5 8
e 6 8 8 6 9
f 6 7 9 6 9
g 10 10 10 5 8
h 6 9 9 5 10
")
Data.num = Data[c("Bob", "Linda", "Tina",
"Gene", "Louisa")]
library(psych)
polychoric(Data.num,
correct=FALSE)
Polychoric correlations
Bob Linda Tina Gene Louis
Bob 1.00
Linda 0.59 1.00
Tina 0.88 0.76 1.00
Gene -0.03 0.16 0.37 1.00
Louisa 0.35 0.47 0.70 0.64 1.00
pairs(data = Data.num,
~ Bob + Linda + Tina + Gene + Louisa)
References
Agresti, A. Measures of Nominal-Ordinal Association. 1981. Journal of the American Statistical Association 76 (375): 524–529.
Freeman, L.C. 1965. Elementary Applied Statistics for Students in Behavioral Science. Wiley.
Freeman, L.C. 1976. A Further Note on Freeman's Measure of Association. Psychometrika 4(2): 273–275.
King, B.M., P.J. Rosopa, and E.W. Minium. 2018. Some (Almost) Assumption-Free Tests. In Statistical Reasoning in the Behavioral Sciences, 7th ed. Wiley.