![[banner]](images/banner.jpg "Cohansey River, Fairfield, New Jersey")
The likert package can be used to produce attractive summaries and plots of one-sample or one-way Likert data. The package is somewhat finicky with the form the data it accepts, however. Data must be in “wide” format. Long-format and wide-format data are discussed in the section “Long-format and wide-format data” in the Types of Variables chapter. In addition, sample sizes for each level of the factor variable must be equal, but you can use NA values for missing observations.
Packages used in this chapter
The packages used in this chapter include:
• psych
• likert
The following commands will install these packages if they are not already installed:
if(!require(psych)){install.packages("psych")}
if(!require(likert)){install.packages("likert")}
The likert package
Input =("
Pooh Piglet
Tigger
3 2
4
5 4
4
4 2
4
4 2
4
4 1
5
4 2
3
4 3
5
4 2
4
5 2
4
5 3
3
")
Data = read.table(textConnection(Input),header=TRUE)
### Change Likert scores
to factor and specify levels
Data$Pooh = factor(Data$Pooh,
levels = c("1", "2", "3", "4", "5"),
ordered = TRUE)
Data$Piglet = factor(Data$Piglet,
levels = c("1", "2", "3", "4", "5"),
ordered = TRUE)
Data$Tigger = factor(Data$Tigger,
levels = c("1", "2", "3", "4", "5"),
ordered = TRUE)
###
Double check the data frame
library(psych)
headTail(Data)
str(Data)
'data.frame': 10 obs. of
3 variables:
$ Pooh : Ord.factor w/ 5 levels "1"<"2"<"3"<"4"<..:
3 5 4 4 4 4 4 4 5 5
$ Piglet: Ord.factor w/ 5 levels "1"<"2"<"3"<"4"<..:
2 4 2 2 1 2 3 2 2 3
$ Tigger: Ord.factor w/ 5 levels "1"<"2"<"3"<"4"<..:
4 4 4 4 5 3 5 4 4 3
summary(Data)
### Remove unnecessary
objects
rm(Input)
Summary statistics and plots with the likert package
Percent responses in each group
library(likert)
likert(Data)
Item 1 2 3
4 5
1 Pooh 0 0 10 60 30
2 Piglet
10 60 20 10 0
3 Tigger 0 0 20 60 20
### Note: if there are NA’s, this summary
doesn’t tell you!
### Count responses
with summary function in native stats package
summary(Data)
Pooh Piglet Tigger
1:0
1:1 1:0
2:0 2:6
2:0
3:1 3:2 3:2
4:6 4:1 4:6
5:3
5:0 5:2
### Note: if there are NA’s, this summary
will tell you
library(likert)
Result = likert(Data)
summary(Result)
Item low neutral high mean
sd
1 Pooh 0
10 90 4.2 0.6324555
3 Tigger 0
20 80 4.0 0.6666667
2 Piglet 70
20 10 2.3 0.8232726
### Note: responses are
grouped into "low", "neutral", and "high"
### Note:
if there are NA’s, this summary doesn’t tell you!
Plots that treat Likert data like factor data
Bar plot
library(likert)
Result = likert(Data)
plot(Result,
type="bar")

### Note:
for the percent numbers,
### responses
are grouped into "low", "neutral", and "high"
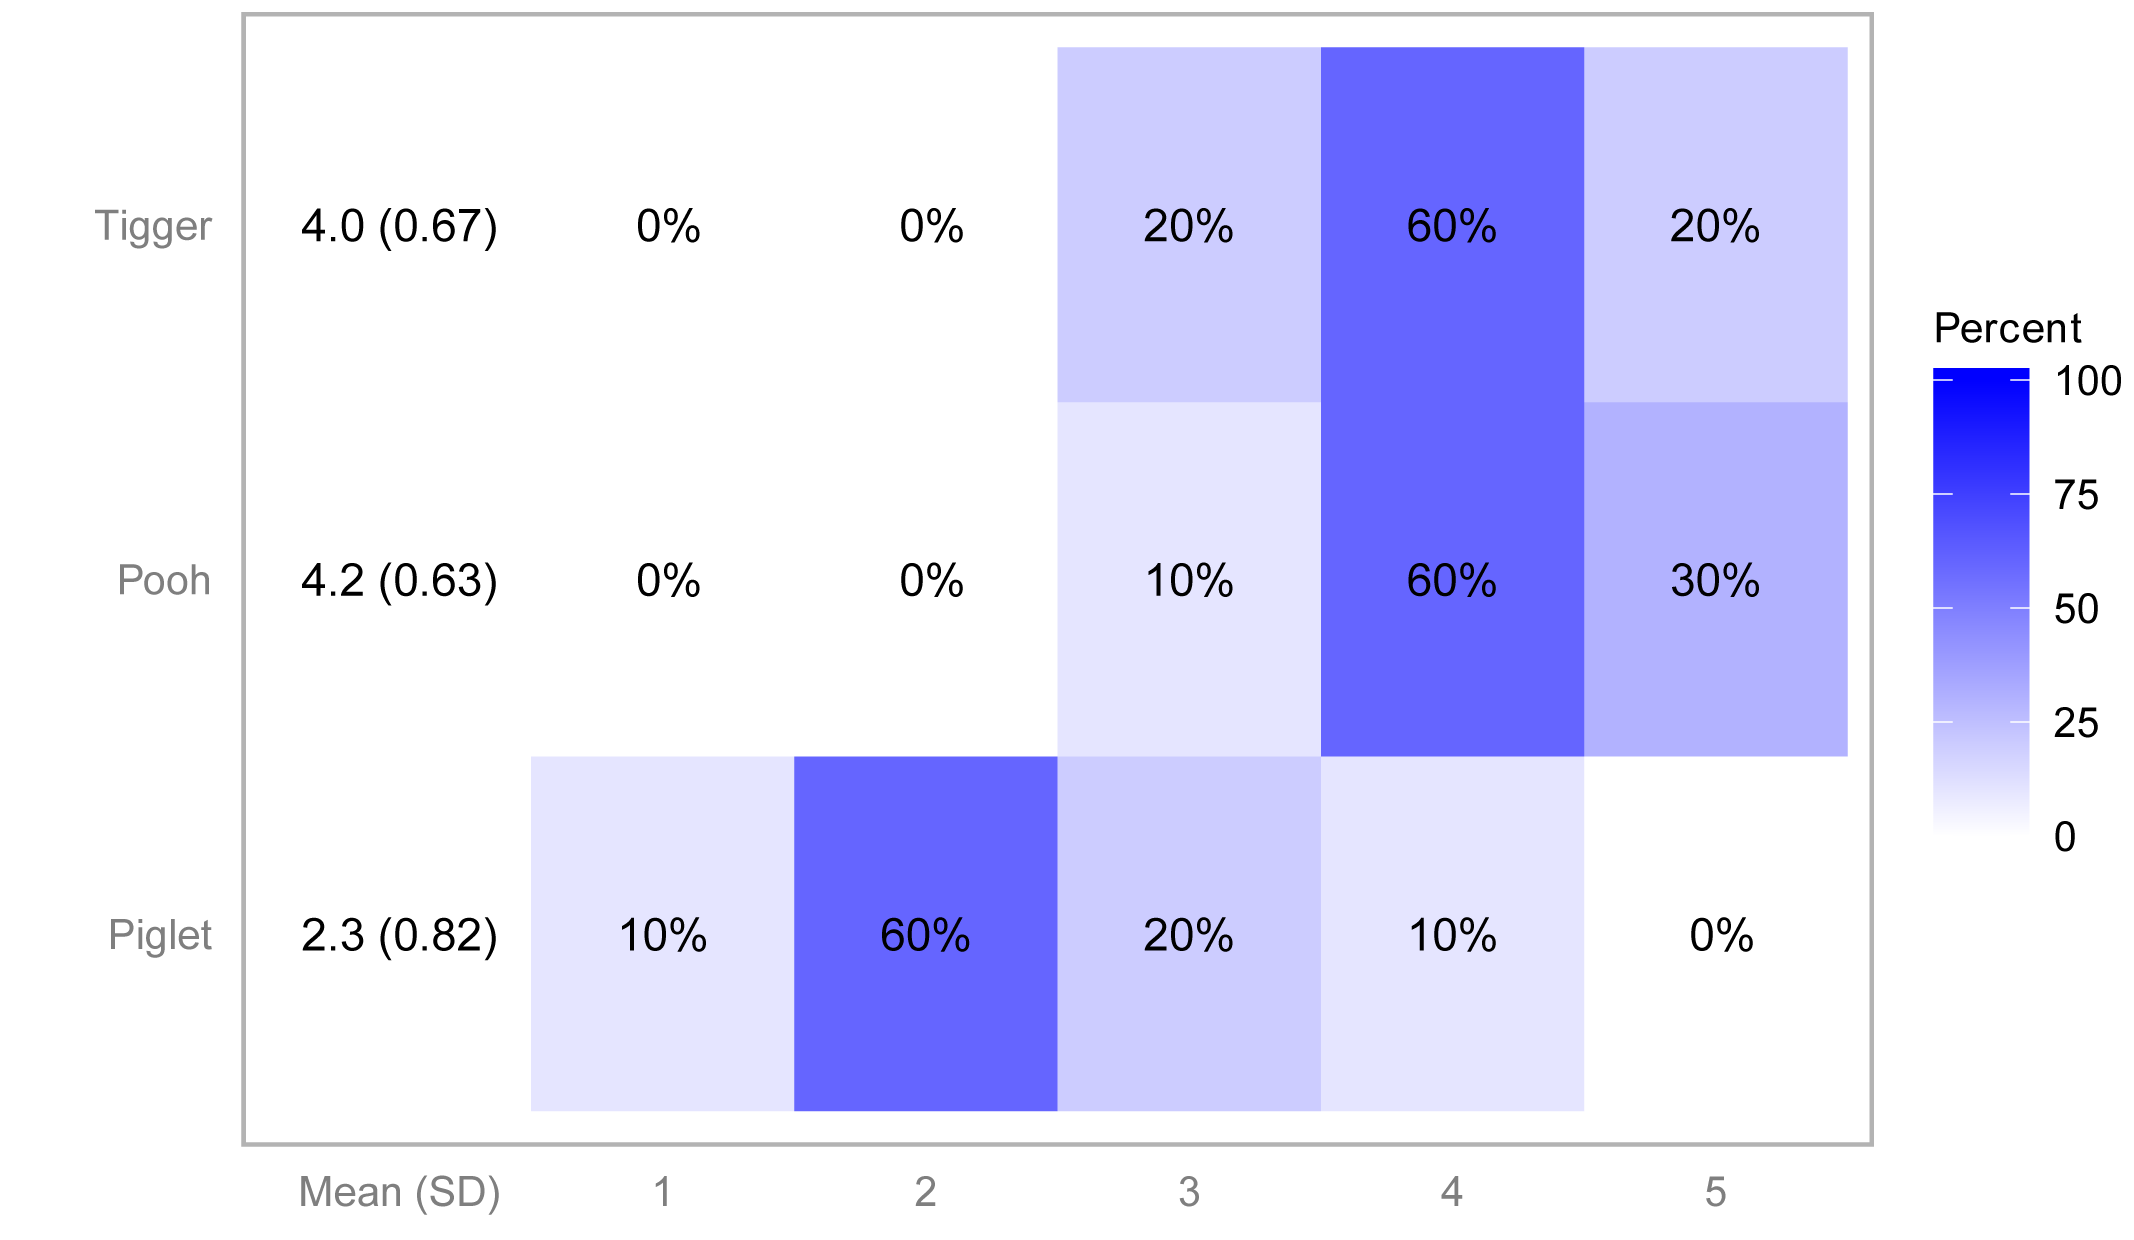
Heat plot
library(likert)
Result = likert(Data)
plot(Result,
type="heat",
low.color = "white",
high.color = "blue",
text.color = "black",
text.size = 4,
wrap = 50)
Plots that treat Likert data like numeric data
Density plot
library(likert)
Result
= likert(Data)
plot(Result,
type="density",
facet = TRUE,
bw
= 0.5)
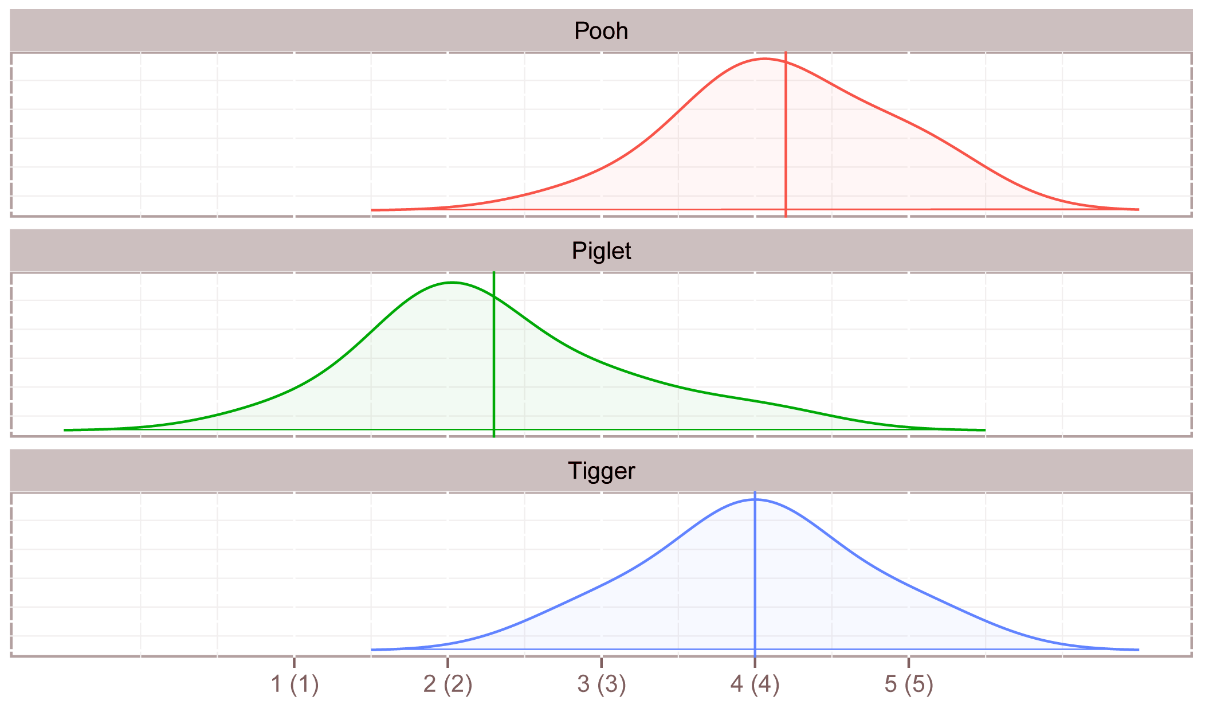
### Note:
Vertical lines are means for each group.
### Note:
Curves are density plots, which show the distribution of values
### similar to a histogram.
References
Jason Bryer, J. and Speerschneider, K. likert: An R package analyzing and visualizing Likert items.
Jason Bryer, J. and Speerschneider, K. Package ‘likert’. cran.r-project.org/web/packages/likert/likert.pdf.